vps36
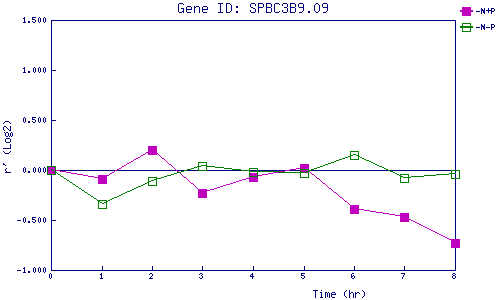
| 0 | 1 | 2 | 3 | 4 | 5 | 6 | 7 | 8 | |
| -N+P | 0.000 | -0.094 | 0.201 | -0.231 | -0.073 | 0.025 | -0.391 | -0.466 | -0.733 |
| -N-P | 0.000 | -0.342 | -0.108 | 0.039 | -0.020 | -0.033 | 0.148 | -0.079 | -0.035 |
|
-N+P: Nitrogen starved in the presence of P-factor -N-P: Nitrogen starved in the absence of P-factor |