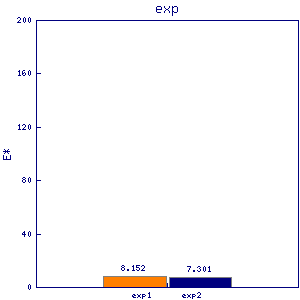
ctf1
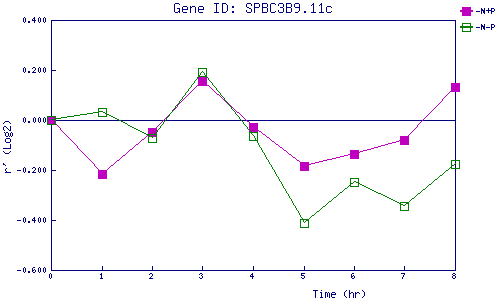
| 0 | 1 | 2 | 3 | 4 | 5 | 6 | 7 | 8 | |
| -N+P | 0.000 | -0.218 | -0.046 | 0.155 | -0.029 | -0.182 | -0.136 | -0.079 | 0.132 |
| -N-P | 0.000 | 0.031 | -0.072 | 0.192 | -0.065 | -0.412 | -0.248 | -0.343 | -0.177 |
|
-N+P: Nitrogen starved in the presence of P-factor -N-P: Nitrogen starved in the absence of P-factor |