rpp102 rpp1-2
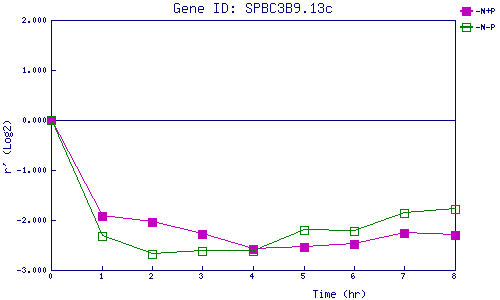
| 0 | 1 | 2 | 3 | 4 | 5 | 6 | 7 | 8 | |
| -N+P | 0.000 | -1.911 | -2.050 | -2.270 | -2.576 | -2.540 | -2.483 | -2.261 | -2.309 |
| -N-P | 0.000 | -2.326 | -2.690 | -2.627 | -2.612 | -2.199 | -2.212 | -1.869 | -1.780 |
|
-N+P: Nitrogen starved in the presence of P-factor -N-P: Nitrogen starved in the absence of P-factor |