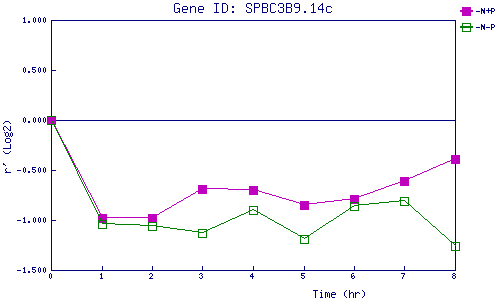
| 0 | 1 | 2 | 3 | 4 | 5 | 6 | 7 | 8 | |
| -N+P | 0.000 | -0.975 | -0.981 | -0.687 | -0.700 | -0.848 | -0.794 | -0.610 | -0.387 |
| -N-P | 0.000 | -1.044 | -1.062 | -1.128 | -0.897 | -1.191 | -0.863 | -0.810 | -1.258 |
|
-N+P: Nitrogen starved in the presence of P-factor -N-P: Nitrogen starved in the absence of P-factor |