| 0 | 1 | 2 | 3 | 4 | 5 | 6 | 7 | 8 | |
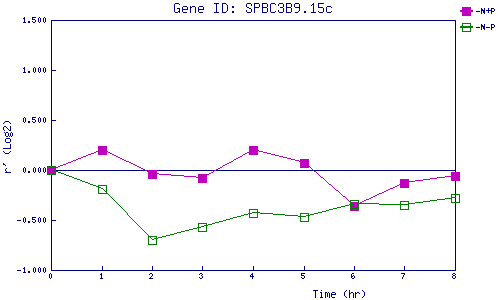
| -N+P | 0.000 | 0.195 | -0.043 | -0.081 | 0.204 | 0.068 | -0.355 | -0.134 | -0.062 |
| -N-P | 0.000 | -0.186 | -0.701 | -0.568 | -0.433 | -0.470 | -0.338 | -0.350 | -0.280 |
|
-N+P: Nitrogen starved in the presence of P-factor -N-P: Nitrogen starved in the absence of P-factor |