| 0 | 1 | 2 | 3 | 4 | 5 | 6 | 7 | 8 | |
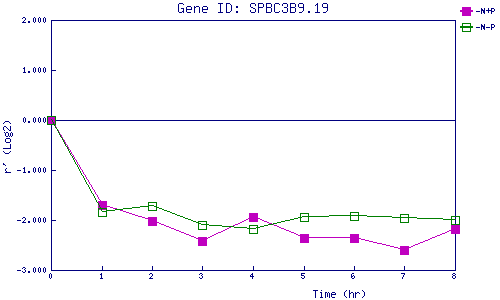
| -N+P | 0.000 | -1.704 | -2.022 | -2.429 | -1.944 | -2.352 | -2.353 | -2.600 | -2.181 |
| -N-P | 0.000 | -1.838 | -1.711 | -2.104 | -2.187 | -1.932 | -1.919 | -1.970 | -2.002 |
|
-N+P: Nitrogen starved in the presence of P-factor -N-P: Nitrogen starved in the absence of P-factor |