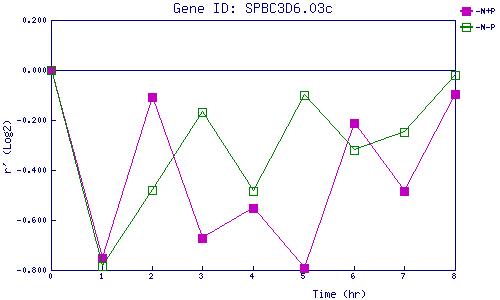
| 0 | 1 | 2 | 3 | 4 | 5 | 6 | 7 | 8 | |
| -N+P | 0.000 | -0.750 | -0.109 | -0.670 | -0.552 | -0.790 | -0.212 | -0.483 | -0.097 |
| -N-P | 0.000 | -0.782 | -0.481 | -0.169 | -0.485 | -0.100 | -0.318 | -0.246 | -0.019 |
|
-N+P: Nitrogen starved in the presence of P-factor -N-P: Nitrogen starved in the absence of P-factor |