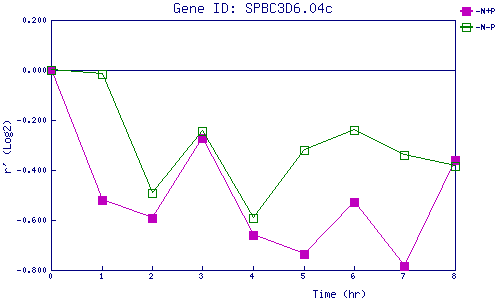
| 0 | 1 | 2 | 3 | 4 | 5 | 6 | 7 | 8 | |
| -N+P | 0.000 | -0.520 | -0.591 | -0.271 | -0.660 | -0.734 | -0.528 | -0.786 | -0.358 |
| -N-P | 0.000 | -0.014 | -0.493 | -0.245 | -0.593 | -0.319 | -0.242 | -0.341 | -0.385 |
|
-N+P: Nitrogen starved in the presence of P-factor -N-P: Nitrogen starved in the absence of P-factor |