ptp4
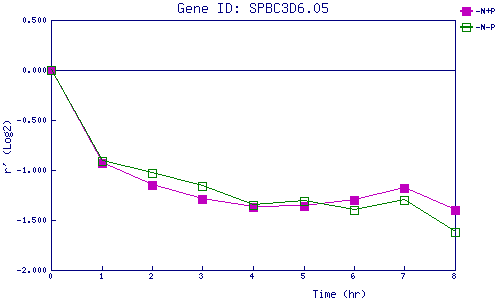
| 0 | 1 | 2 | 3 | 4 | 5 | 6 | 7 | 8 | |
| -N+P | 0.000 | -0.934 | -1.146 | -1.291 | -1.371 | -1.364 | -1.302 | -1.176 | -1.405 |
| -N-P | 0.000 | -0.907 | -1.034 | -1.159 | -1.347 | -1.309 | -1.396 | -1.296 | -1.618 |
|
-N+P: Nitrogen starved in the presence of P-factor -N-P: Nitrogen starved in the absence of P-factor |