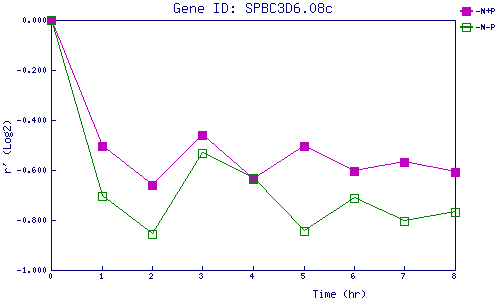
| 0 | 1 | 2 | 3 | 4 | 5 | 6 | 7 | 8 | |
| -N+P | 0.000 | -0.505 | -0.659 | -0.459 | -0.635 | -0.505 | -0.605 | -0.567 | -0.606 |
| -N-P | 0.000 | -0.705 | -0.858 | -0.533 | -0.634 | -0.843 | -0.710 | -0.805 | -0.770 |
|
-N+P: Nitrogen starved in the presence of P-factor -N-P: Nitrogen starved in the absence of P-factor |