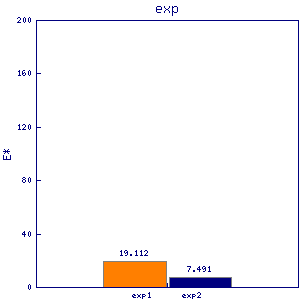
dpb4
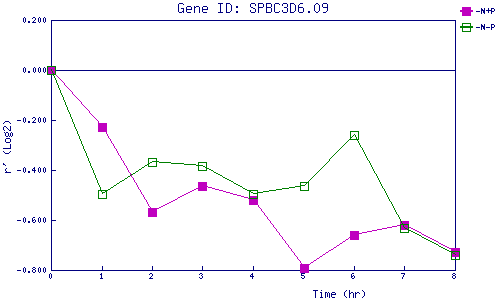
| 0 | 1 | 2 | 3 | 4 | 5 | 6 | 7 | 8 | |
| -N+P | 0.000 | -0.227 | -0.567 | -0.466 | -0.519 | -0.792 | -0.660 | -0.619 | -0.728 |
| -N-P | 0.000 | -0.498 | -0.367 | -0.386 | -0.496 | -0.466 | -0.261 | -0.632 | -0.740 |
|
-N+P: Nitrogen starved in the presence of P-factor -N-P: Nitrogen starved in the absence of P-factor |