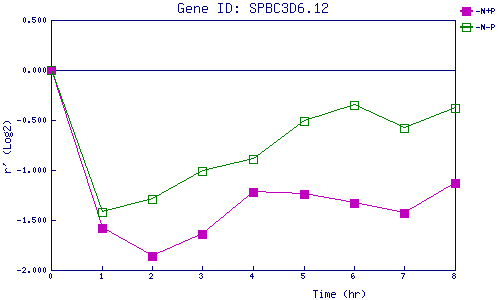
| 0 | 1 | 2 | 3 | 4 | 5 | 6 | 7 | 8 | |
| -N+P | 0.000 | -1.575 | -1.860 | -1.635 | -1.215 | -1.240 | -1.332 | -1.430 | -1.129 |
| -N-P | 0.000 | -1.416 | -1.287 | -1.013 | -0.887 | -0.509 | -0.349 | -0.580 | -0.380 |
|
-N+P: Nitrogen starved in the presence of P-factor -N-P: Nitrogen starved in the absence of P-factor |