rps25-1 rps2501
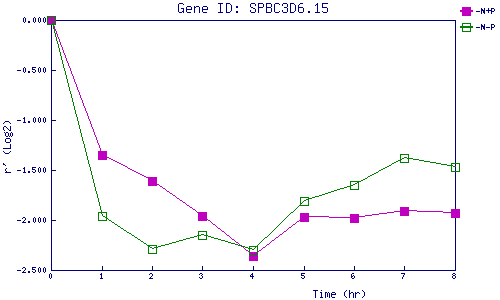
| 0 | 1 | 2 | 3 | 4 | 5 | 6 | 7 | 8 | |
| -N+P | 0.000 | -1.346 | -1.611 | -1.955 | -2.362 | -1.967 | -1.981 | -1.913 | -1.932 |
| -N-P | 0.000 | -1.962 | -2.291 | -2.154 | -2.301 | -1.809 | -1.654 | -1.379 | -1.467 |
|
-N+P: Nitrogen starved in the presence of P-factor -N-P: Nitrogen starved in the absence of P-factor |