hsp16
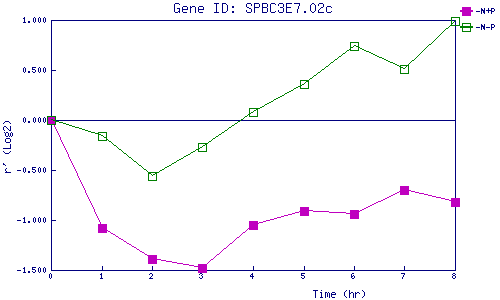
| 0 | 1 | 2 | 3 | 4 | 5 | 6 | 7 | 8 | |
| -N+P | 0.000 | -1.084 | -1.391 | -1.478 | -1.051 | -0.914 | -0.942 | -0.700 | -0.824 |
| -N-P | 0.000 | -0.155 | -0.558 | -0.270 | 0.078 | 0.363 | 0.737 | 0.510 | 0.989 |
|
-N+P: Nitrogen starved in the presence of P-factor -N-P: Nitrogen starved in the absence of P-factor |