| 0 | 1 | 2 | 3 | 4 | 5 | 6 | 7 | 8 | |
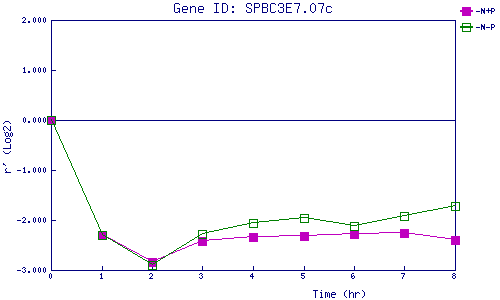
| -N+P | 0.000 | -2.299 | -2.834 | -2.412 | -2.344 | -2.310 | -2.288 | -2.256 | -2.394 |
| -N-P | 0.000 | -2.295 | -2.895 | -2.278 | -2.064 | -1.964 | -2.123 | -1.925 | -1.716 |
|
-N+P: Nitrogen starved in the presence of P-factor -N-P: Nitrogen starved in the absence of P-factor |