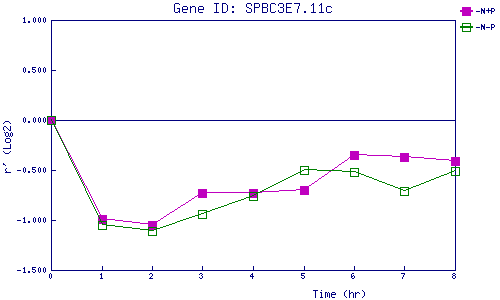
| 0 | 1 | 2 | 3 | 4 | 5 | 6 | 7 | 8 | |
| -N+P | 0.000 | -0.992 | -1.047 | -0.727 | -0.726 | -0.704 | -0.349 | -0.374 | -0.408 |
| -N-P | 0.000 | -1.049 | -1.112 | -0.942 | -0.761 | -0.503 | -0.520 | -0.709 | -0.514 |
|
-N+P: Nitrogen starved in the presence of P-factor -N-P: Nitrogen starved in the absence of P-factor |