reserved_name_cfh4
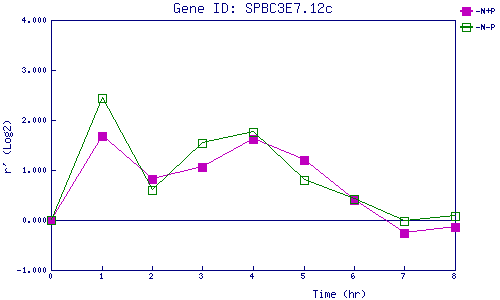
| 0 | 1 | 2 | 3 | 4 | 5 | 6 | 7 | 8 | |
| -N+P | 0.000 | 1.678 | 0.826 | 1.068 | 1.622 | 1.190 | 0.399 | -0.258 | -0.141 |
| -N-P | 0.000 | 2.430 | 0.599 | 1.549 | 1.757 | 0.806 | 0.419 | -0.014 | 0.082 |
|
-N+P: Nitrogen starved in the presence of P-factor -N-P: Nitrogen starved in the absence of P-factor |