trr1 caf4
| 0 | 1 | 2 | 3 | 4 | 5 | 6 | 7 | 8 | |
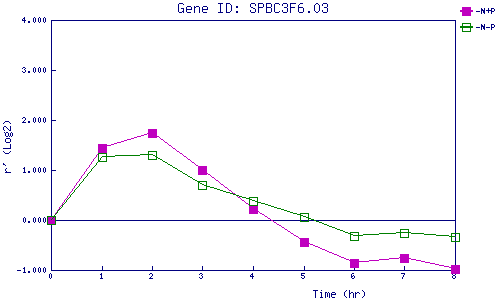
| -N+P | 0.000 | 1.447 | 1.739 | 1.010 | 0.225 | -0.439 | -0.851 | -0.764 | -0.974 |
| -N-P | 0.000 | 1.265 | 1.296 | 0.692 | 0.373 | 0.058 | -0.322 | -0.255 | -0.336 |
|
-N+P: Nitrogen starved in the presence of P-factor -N-P: Nitrogen starved in the absence of P-factor |
