| 0 | 1 | 2 | 3 | 4 | 5 | 6 | 7 | 8 | |
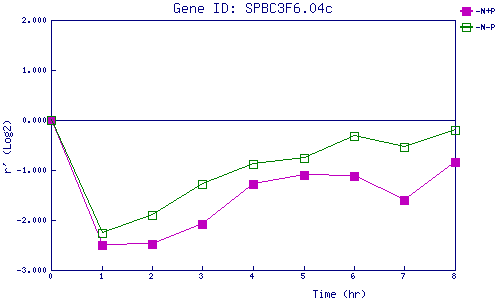
| -N+P | 0.000 | -2.505 | -2.490 | -2.089 | -1.272 | -1.103 | -1.122 | -1.594 | -0.832 |
| -N-P | 0.000 | -2.264 | -1.893 | -1.270 | -0.883 | -0.750 | -0.313 | -0.540 | -0.196 |
|
-N+P: Nitrogen starved in the presence of P-factor -N-P: Nitrogen starved in the absence of P-factor |