| 0 | 1 | 2 | 3 | 4 | 5 | 6 | 7 | 8 | |
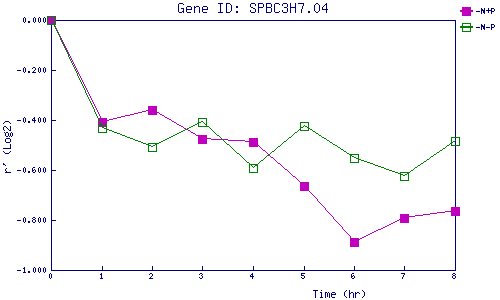
| -N+P | 0.000 | -0.408 | -0.360 | -0.477 | -0.487 | -0.666 | -0.888 | -0.791 | -0.764 |
| -N-P | 0.000 | -0.430 | -0.507 | -0.410 | -0.592 | -0.425 | -0.554 | -0.626 | -0.484 |
|
-N+P: Nitrogen starved in the presence of P-factor -N-P: Nitrogen starved in the absence of P-factor |