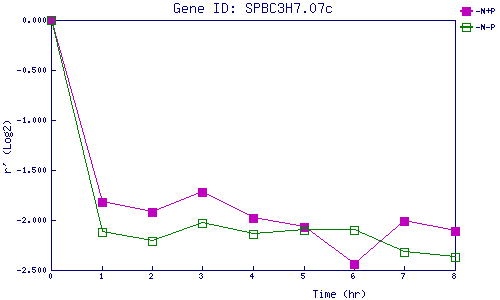
| 0 | 1 | 2 | 3 | 4 | 5 | 6 | 7 | 8 | |
| -N+P | 0.000 | -1.818 | -1.920 | -1.717 | -1.977 | -2.067 | -2.436 | -2.011 | -2.111 |
| -N-P | 0.000 | -2.118 | -2.211 | -2.032 | -2.135 | -2.100 | -2.096 | -2.319 | -2.373 |
|
-N+P: Nitrogen starved in the presence of P-factor -N-P: Nitrogen starved in the absence of P-factor |