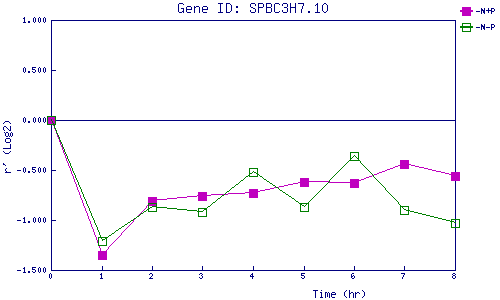
| 0 | 1 | 2 | 3 | 4 | 5 | 6 | 7 | 8 | |
| -N+P | 0.000 | -1.354 | -0.812 | -0.758 | -0.731 | -0.620 | -0.627 | -0.441 | -0.556 |
| -N-P | 0.000 | -1.207 | -0.869 | -0.922 | -0.524 | -0.870 | -0.360 | -0.905 | -1.029 |
|
-N+P: Nitrogen starved in the presence of P-factor -N-P: Nitrogen starved in the absence of P-factor |