| 0 | 1 | 2 | 3 | 4 | 5 | 6 | 7 | 8 | |
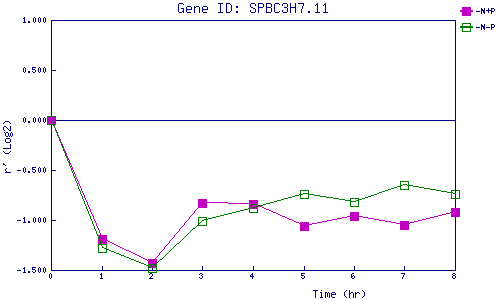
| -N+P | 0.000 | -1.188 | -1.428 | -0.833 | -0.839 | -1.064 | -0.957 | -1.046 | -0.923 |
| -N-P | 0.000 | -1.285 | -1.475 | -1.012 | -0.883 | -0.742 | -0.824 | -0.647 | -0.736 |
|
-N+P: Nitrogen starved in the presence of P-factor -N-P: Nitrogen starved in the absence of P-factor |