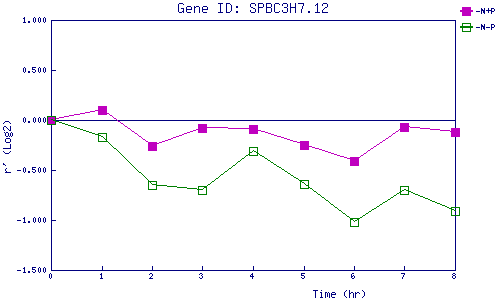
| 0 | 1 | 2 | 3 | 4 | 5 | 6 | 7 | 8 | |
| -N+P | 0.000 | 0.099 | -0.260 | -0.080 | -0.094 | -0.247 | -0.413 | -0.066 | -0.119 |
| -N-P | 0.000 | -0.174 | -0.648 | -0.697 | -0.307 | -0.644 | -1.019 | -0.697 | -0.913 |
|
-N+P: Nitrogen starved in the presence of P-factor -N-P: Nitrogen starved in the absence of P-factor |