| 0 | 1 | 2 | 3 | 4 | 5 | 6 | 7 | 8 | |
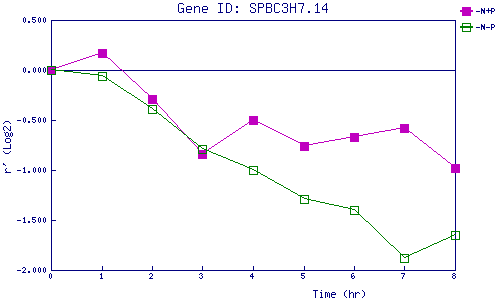
| -N+P | 0.000 | 0.168 | -0.289 | -0.835 | -0.501 | -0.760 | -0.673 | -0.575 | -0.976 |
| -N-P | 0.000 | -0.058 | -0.390 | -0.789 | -1.005 | -1.289 | -1.404 | -1.881 | -1.652 |
|
-N+P: Nitrogen starved in the presence of P-factor -N-P: Nitrogen starved in the absence of P-factor |