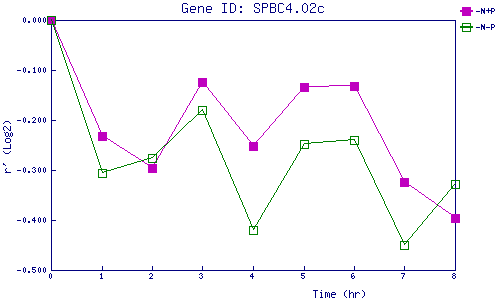
| 0 | 1 | 2 | 3 | 4 | 5 | 6 | 7 | 8 | |
| -N+P | 0.000 | -0.233 | -0.297 | -0.123 | -0.253 | -0.134 | -0.132 | -0.323 | -0.395 |
| -N-P | 0.000 | -0.306 | -0.277 | -0.180 | -0.421 | -0.248 | -0.241 | -0.450 | -0.327 |
|
-N+P: Nitrogen starved in the presence of P-factor -N-P: Nitrogen starved in the absence of P-factor |