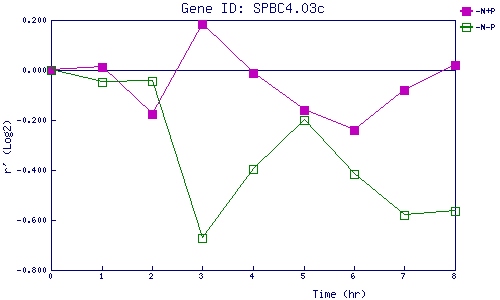
| 0 | 1 | 2 | 3 | 4 | 5 | 6 | 7 | 8 | |
| -N+P | 0.000 | 0.013 | -0.175 | 0.186 | -0.011 | -0.162 | -0.241 | -0.082 | 0.021 |
| -N-P | 0.000 | -0.049 | -0.043 | -0.674 | -0.397 | -0.202 | -0.414 | -0.581 | -0.564 |
|
-N+P: Nitrogen starved in the presence of P-factor -N-P: Nitrogen starved in the absence of P-factor |