cdc19 nda1 mcm2
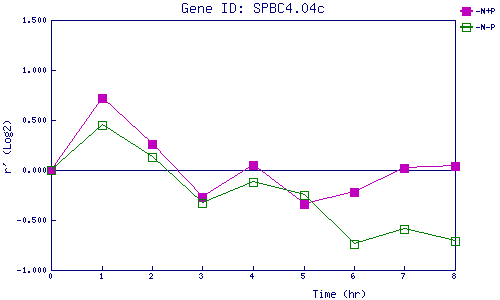
| 0 | 1 | 2 | 3 | 4 | 5 | 6 | 7 | 8 | |
| -N+P | 0.000 | 0.716 | 0.260 | -0.266 | 0.051 | -0.338 | -0.218 | 0.025 | 0.042 |
| -N-P | 0.000 | 0.452 | 0.129 | -0.333 | -0.118 | -0.253 | -0.740 | -0.586 | -0.710 |
|
-N+P: Nitrogen starved in the presence of P-factor -N-P: Nitrogen starved in the absence of P-factor |