mlo2
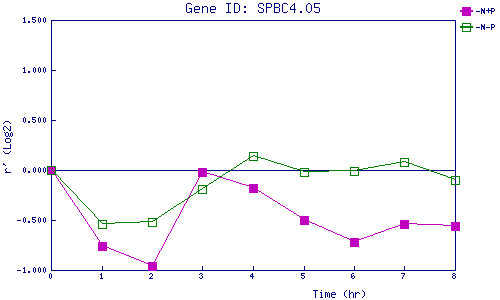
| 0 | 1 | 2 | 3 | 4 | 5 | 6 | 7 | 8 | |
| -N+P | 0.000 | -0.762 | -0.959 | -0.016 | -0.175 | -0.504 | -0.715 | -0.541 | -0.564 |
| -N-P | 0.000 | -0.542 | -0.516 | -0.189 | 0.140 | -0.025 | -0.013 | 0.084 | -0.101 |
|
-N+P: Nitrogen starved in the presence of P-factor -N-P: Nitrogen starved in the absence of P-factor |