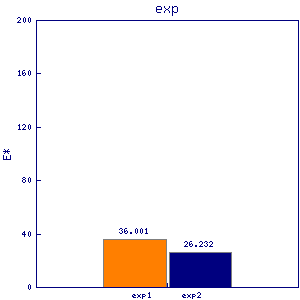
mts2 rpt2
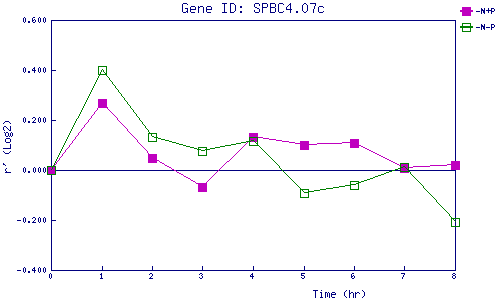
| 0 | 1 | 2 | 3 | 4 | 5 | 6 | 7 | 8 | |
| -N+P | 0.000 | 0.267 | 0.049 | -0.067 | 0.133 | 0.100 | 0.107 | 0.006 | 0.021 |
| -N-P | 0.000 | 0.400 | 0.133 | 0.076 | 0.117 | -0.093 | -0.059 | 0.013 | -0.207 |
|
-N+P: Nitrogen starved in the presence of P-factor -N-P: Nitrogen starved in the absence of P-factor |