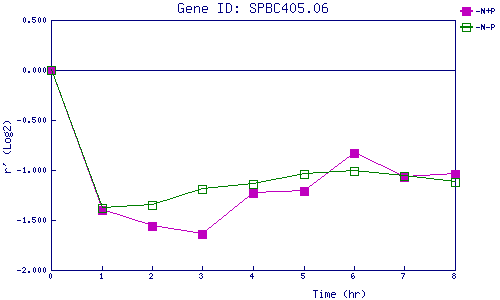
| 0 | 1 | 2 | 3 | 4 | 5 | 6 | 7 | 8 | |
| -N+P | 0.000 | -1.395 | -1.566 | -1.636 | -1.233 | -1.212 | -0.832 | -1.071 | -1.035 |
| -N-P | 0.000 | -1.381 | -1.349 | -1.193 | -1.140 | -1.042 | -1.012 | -1.065 | -1.119 |
|
-N+P: Nitrogen starved in the presence of P-factor -N-P: Nitrogen starved in the absence of P-factor |