rpl36-2 rpl3602 rpl36
| 0 | 1 | 2 | 3 | 4 | 5 | 6 | 7 | 8 | |
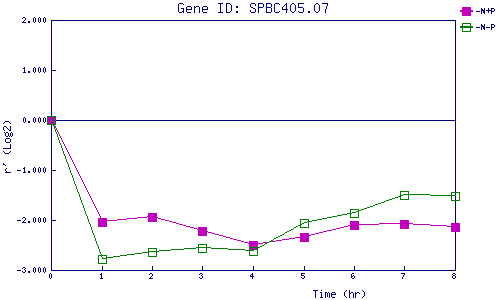
| -N+P | 0.000 | -2.049 | -1.939 | -2.227 | -2.509 | -2.349 | -2.102 | -2.071 | -2.135 |
| -N-P | 0.000 | -2.782 | -2.646 | -2.570 | -2.627 | -2.063 | -1.866 | -1.496 | -1.527 |
|
-N+P: Nitrogen starved in the presence of P-factor -N-P: Nitrogen starved in the absence of P-factor |
