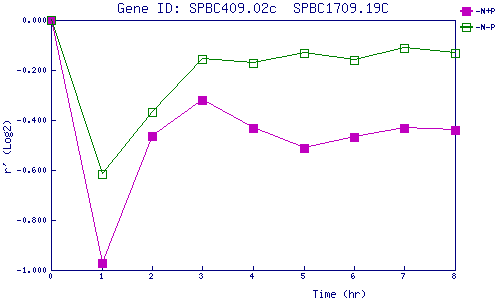
| 0 | 1 | 2 | 3 | 4 | 5 | 6 | 7 | 8 | |
| -N+P | 0.000 | -0.973 | -0.463 | -0.318 | -0.431 | -0.513 | -0.469 | -0.433 | -0.440 |
| -N-P | 0.000 | -0.615 | -0.367 | -0.155 | -0.173 | -0.132 | -0.162 | -0.112 | -0.131 |
|
-N+P: Nitrogen starved in the presence of P-factor -N-P: Nitrogen starved in the absence of P-factor |