mis12
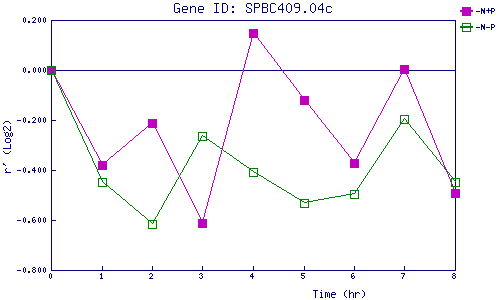
| 0 | 1 | 2 | 3 | 4 | 5 | 6 | 7 | 8 | |
| -N+P | 0.000 | -0.380 | -0.211 | -0.613 | 0.149 | -0.122 | -0.371 | 0.003 | -0.492 |
| -N-P | 0.000 | -0.448 | -0.615 | -0.264 | -0.407 | -0.531 | -0.495 | -0.197 | -0.446 |
|
-N+P: Nitrogen starved in the presence of P-factor -N-P: Nitrogen starved in the absence of P-factor |
