psh1 skp1 sph1
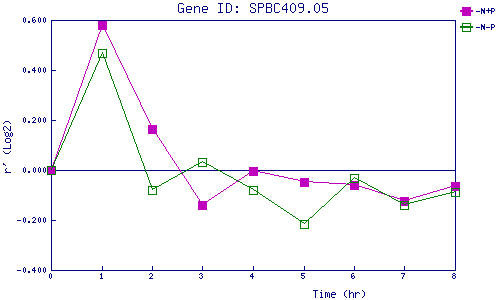
| 0 | 1 | 2 | 3 | 4 | 5 | 6 | 7 | 8 | |
| -N+P | 0.000 | 0.581 | 0.165 | -0.141 | -0.005 | -0.047 | -0.060 | -0.125 | -0.065 |
| -N-P | 0.000 | 0.469 | -0.078 | 0.032 | -0.078 | -0.215 | -0.031 | -0.141 | -0.087 |
|
-N+P: Nitrogen starved in the presence of P-factor -N-P: Nitrogen starved in the absence of P-factor |