reserved_name_uch2 uch2
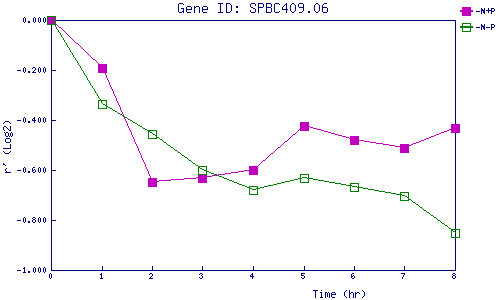
| 0 | 1 | 2 | 3 | 4 | 5 | 6 | 7 | 8 | |
| -N+P | 0.000 | -0.190 | -0.649 | -0.630 | -0.602 | -0.422 | -0.481 | -0.514 | -0.431 |
| -N-P | 0.000 | -0.336 | -0.456 | -0.601 | -0.678 | -0.632 | -0.668 | -0.704 | -0.852 |
|
-N+P: Nitrogen starved in the presence of P-factor -N-P: Nitrogen starved in the absence of P-factor |