wis1 spc2 smf2
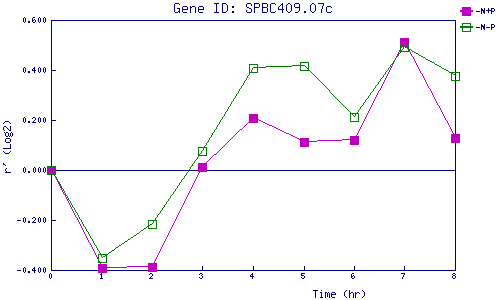
| 0 | 1 | 2 | 3 | 4 | 5 | 6 | 7 | 8 | |
| -N+P | 0.000 | -0.392 | -0.388 | 0.012 | 0.209 | 0.112 | 0.119 | 0.510 | 0.130 |
| -N-P | 0.000 | -0.350 | -0.215 | 0.075 | 0.410 | 0.414 | 0.213 | 0.491 | 0.374 |
|
-N+P: Nitrogen starved in the presence of P-factor -N-P: Nitrogen starved in the absence of P-factor |