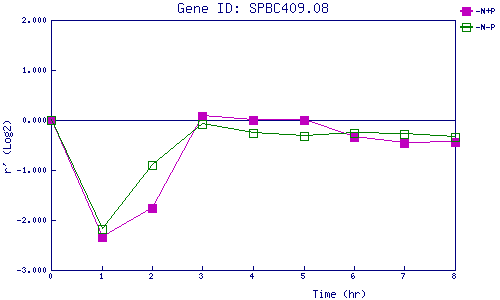
| 0 | 1 | 2 | 3 | 4 | 5 | 6 | 7 | 8 | |
| -N+P | 0.000 | -2.335 | -1.767 | 0.081 | 0.008 | -0.004 | -0.344 | -0.459 | -0.439 |
| -N-P | 0.000 | -2.173 | -0.897 | -0.070 | -0.260 | -0.327 | -0.268 | -0.290 | -0.335 |
|
-N+P: Nitrogen starved in the presence of P-factor -N-P: Nitrogen starved in the absence of P-factor |
