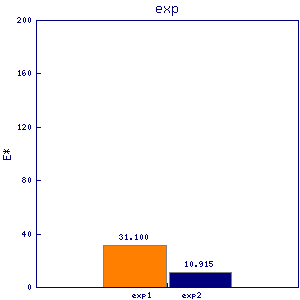
ade7
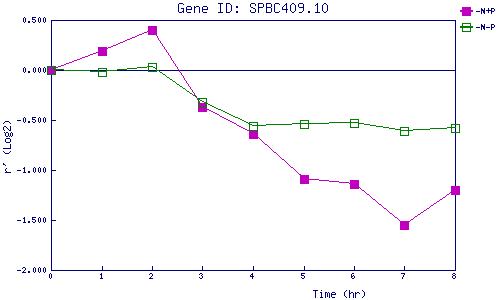
| 0 | 1 | 2 | 3 | 4 | 5 | 6 | 7 | 8 | |
| -N+P | 0.000 | 0.187 | 0.398 | -0.369 | -0.635 | -1.087 | -1.141 | -1.552 | -1.205 |
| -N-P | 0.000 | -0.025 | 0.026 | -0.325 | -0.564 | -0.535 | -0.531 | -0.611 | -0.577 |
|
-N+P: Nitrogen starved in the presence of P-factor -N-P: Nitrogen starved in the absence of P-factor |