meu18
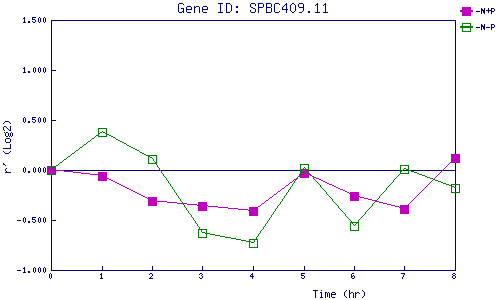
| 0 | 1 | 2 | 3 | 4 | 5 | 6 | 7 | 8 | |
| -N+P | 0.000 | -0.062 | -0.309 | -0.363 | -0.410 | -0.027 | -0.265 | -0.388 | 0.119 |
| -N-P | 0.000 | 0.384 | 0.110 | -0.626 | -0.734 | 0.020 | -0.555 | 0.013 | -0.176 |
|
-N+P: Nitrogen starved in the presence of P-factor -N-P: Nitrogen starved in the absence of P-factor |