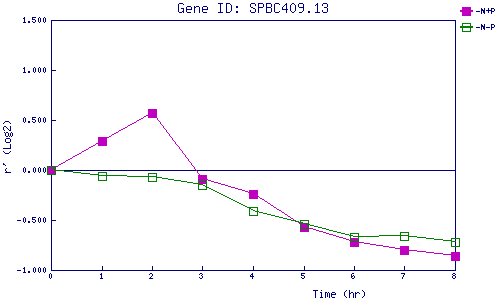
| 0 | 1 | 2 | 3 | 4 | 5 | 6 | 7 | 8 | |
| -N+P | 0.000 | 0.290 | 0.571 | -0.089 | -0.244 | -0.570 | -0.720 | -0.804 | -0.859 |
| -N-P | 0.000 | -0.064 | -0.073 | -0.151 | -0.411 | -0.538 | -0.669 | -0.665 | -0.720 |
|
-N+P: Nitrogen starved in the presence of P-factor -N-P: Nitrogen starved in the absence of P-factor |