| 0 | 1 | 2 | 3 | 4 | 5 | 6 | 7 | 8 | |
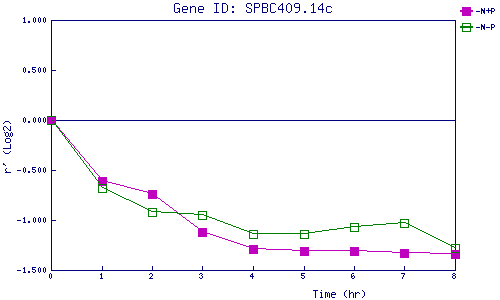
| -N+P | 0.000 | -0.614 | -0.744 | -1.118 | -1.290 | -1.306 | -1.313 | -1.326 | -1.335 |
| -N-P | 0.000 | -0.685 | -0.920 | -0.952 | -1.135 | -1.140 | -1.072 | -1.026 | -1.282 |
|
-N+P: Nitrogen starved in the presence of P-factor -N-P: Nitrogen starved in the absence of P-factor |