| 0 | 1 | 2 | 3 | 4 | 5 | 6 | 7 | 8 | |
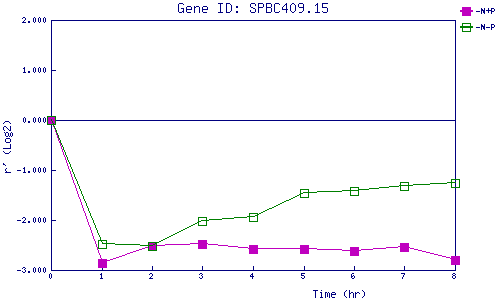
| -N+P | 0.000 | -2.861 | -2.530 | -2.490 | -2.589 | -2.586 | -2.619 | -2.540 | -2.801 |
| -N-P | 0.000 | -2.482 | -2.510 | -2.017 | -1.932 | -1.457 | -1.415 | -1.316 | -1.259 |
|
-N+P: Nitrogen starved in the presence of P-factor -N-P: Nitrogen starved in the absence of P-factor |
