| 0 | 1 | 2 | 3 | 4 | 5 | 6 | 7 | 8 | |
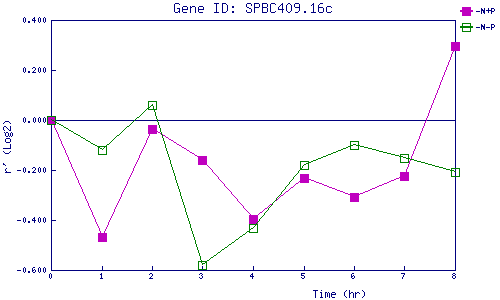
| -N+P | 0.000 | -0.468 | -0.035 | -0.162 | -0.397 | -0.230 | -0.308 | -0.224 | 0.296 |
| -N-P | 0.000 | -0.118 | 0.061 | -0.579 | -0.430 | -0.180 | -0.099 | -0.154 | -0.206 |
|
-N+P: Nitrogen starved in the presence of P-factor -N-P: Nitrogen starved in the absence of P-factor |