sec66
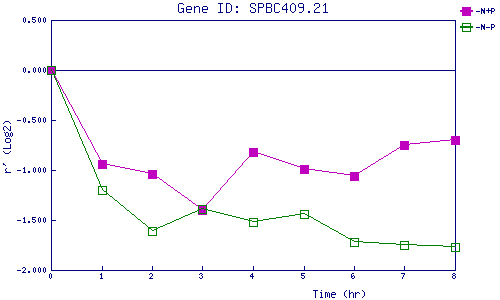
| 0 | 1 | 2 | 3 | 4 | 5 | 6 | 7 | 8 | |
| -N+P | 0.000 | -0.941 | -1.041 | -1.402 | -0.819 | -0.988 | -1.055 | -0.751 | -0.695 |
| -N-P | 0.000 | -1.197 | -1.607 | -1.386 | -1.515 | -1.440 | -1.717 | -1.752 | -1.766 |
|
-N+P: Nitrogen starved in the presence of P-factor -N-P: Nitrogen starved in the absence of P-factor |