his4
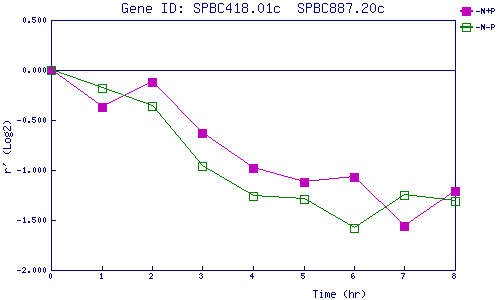
| 0 | 1 | 2 | 3 | 4 | 5 | 6 | 7 | 8 | |
| -N+P | 0.000 | -0.369 | -0.124 | -0.633 | -0.978 | -1.120 | -1.073 | -1.559 | -1.214 |
| -N-P | 0.000 | -0.177 | -0.358 | -0.960 | -1.256 | -1.294 | -1.576 | -1.247 | -1.311 |
|
-N+P: Nitrogen starved in the presence of P-factor -N-P: Nitrogen starved in the absence of P-factor |