eca39
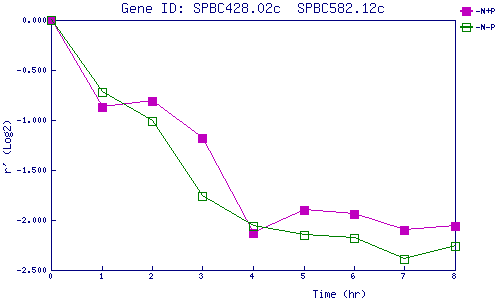
| 0 | 1 | 2 | 3 | 4 | 5 | 6 | 7 | 8 | |
| -N+P | 0.000 | -0.869 | -0.808 | -1.185 | -2.130 | -1.896 | -1.937 | -2.104 | -2.059 |
| -N-P | 0.000 | -0.722 | -1.012 | -1.760 | -2.055 | -2.147 | -2.182 | -2.393 | -2.263 |
|
-N+P: Nitrogen starved in the presence of P-factor -N-P: Nitrogen starved in the absence of P-factor |