pho4
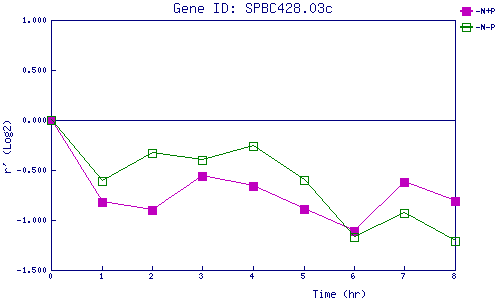
| 0 | 1 | 2 | 3 | 4 | 5 | 6 | 7 | 8 | |
| -N+P | 0.000 | -0.823 | -0.895 | -0.565 | -0.660 | -0.887 | -1.106 | -0.619 | -0.810 |
| -N-P | 0.000 | -0.612 | -0.326 | -0.397 | -0.261 | -0.602 | -1.170 | -0.926 | -1.208 |
|
-N+P: Nitrogen starved in the presence of P-factor -N-P: Nitrogen starved in the absence of P-factor |