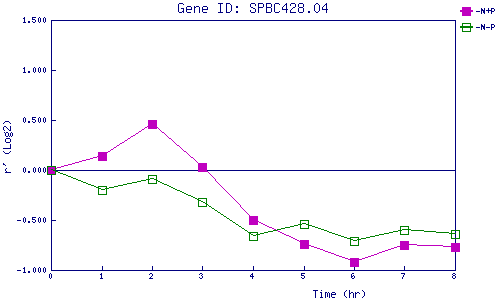
| 0 | 1 | 2 | 3 | 4 | 5 | 6 | 7 | 8 | |
| -N+P | 0.000 | 0.141 | 0.456 | 0.033 | -0.497 | -0.744 | -0.920 | -0.751 | -0.766 |
| -N-P | 0.000 | -0.195 | -0.086 | -0.323 | -0.663 | -0.542 | -0.711 | -0.595 | -0.637 |
|
-N+P: Nitrogen starved in the presence of P-factor -N-P: Nitrogen starved in the absence of P-factor |