meu6
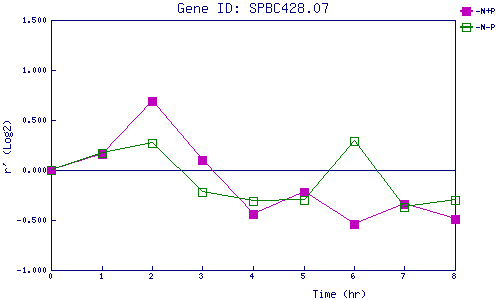
| 0 | 1 | 2 | 3 | 4 | 5 | 6 | 7 | 8 | |
| -N+P | 0.000 | 0.159 | 0.691 | 0.096 | -0.440 | -0.221 | -0.545 | -0.341 | -0.492 |
| -N-P | 0.000 | 0.167 | 0.272 | -0.215 | -0.314 | -0.296 | 0.291 | -0.369 | -0.297 |
|
-N+P: Nitrogen starved in the presence of P-factor -N-P: Nitrogen starved in the absence of P-factor |